
Fibrograph Method or Photoelectric Scanning Method:
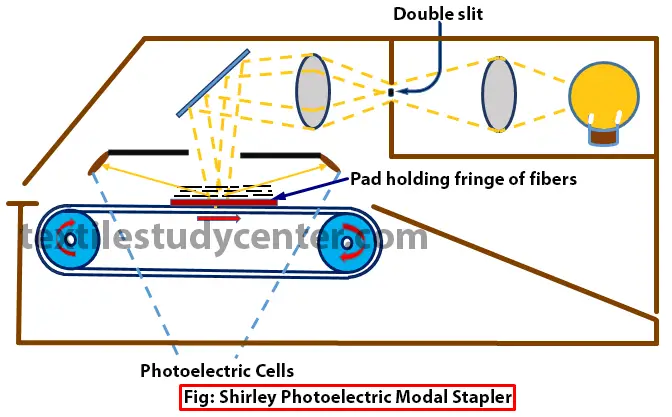
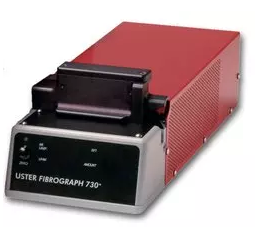
The original idea of the photoelectric scanning or Fibrograph method has been developed by Hertel in 1940 for testing cotton lint. This test method is much faster than the array method and is used widely in fiber laboratories for measuring fiber length and length distribution. These tests are performed with a Fibrograph instrument, which is a photoelectric device (fig.).
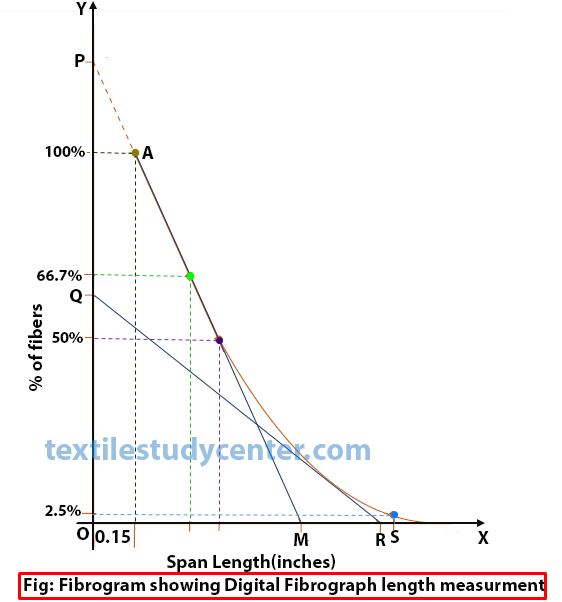
In Fibrograph, fiber samples are presented in the form of a pair of carefully prepared fringes. The light transmitted through these fringes is monitored by photoelectric current. The amount of light passing through the fiber sample is linearly proportional to the number of fibers in the light path. The changes in the photoelectric current are recorded graphically in the form of a Fibrogram as shown in Fig. From this Fibrogram various length parameters of practical interest, such as span length, mean length (OM), upper-half mean length (OR) and index of uniformity, given as the ratio of OM to OR, can be analyzed.
Preparation of Test Specimen
Test specimen can be prepared from the laboratory sample by on of the following method.
1) Hand Combing Method
Pick up a handful of cotton from the laboratory sample and separate it into two parts by pulling so as to expose a fresh surface of projecting fibers. Holding one of the hand combs in one hand and the opened lump of cotton in the other, transfer some of the projecting fibers on to the comb. Pick fresh lumps of cotton, and proceed in the same manner so that a pair of combs is filled with sufficient quantity of fibers drawn from 8 to 10 randomly picked lumps. Hold one comb in each hand, and untangle and parallelize the projecting fibers by mutual combing. The pair of combed beards constitutes the test specimen.
2) Fibro-Sampler Method
Mount one of the fibro-sample combs in the comb holder of the Fibro sampler, with the teeth uppermost. Place the laboratory sample in the cage and press it against the perforated surface. Maintain the pressure and rotate the sample holder round the drum counter-clockwise through 360°. Remove the loaded comb from the holder. Turn the sample in the cage to expose a fresh surface, and mount fibers in one more comb. Either one or a pair of combed beards constitute the test specimen depending upon the model of the instrument being used.
Fibrogram:
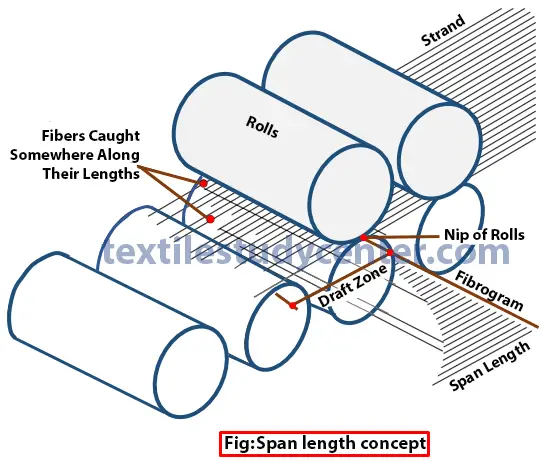
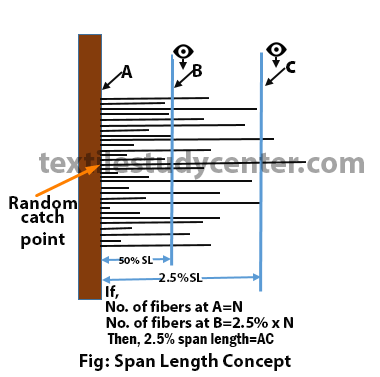
Fibrogram is an arrangement of fibers from shortest to longest in terms of span lengths. Fibrogram test are required for determining the length uniformity of fibers in the sample of cotton.
At any instant in time, fibers caught by the roller nips will depend on the randomness of their overlapping lengths; therefore, not all the length of a given fiber projects into draft zone. The lengths that project into the draft zone are called the span lengths, and the cumulative frequency distribution of the span length gives the Fibrogram.
Digital Fibrograph:
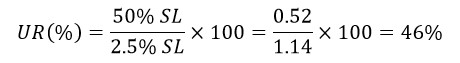
The digital fibrograph gives the tests results in digits or numerical form. Suppose In the 2.5% span the length is 1.14 inch while in the 50 percent span the length is 0.52 inch. The uniformity ratio is 46%.
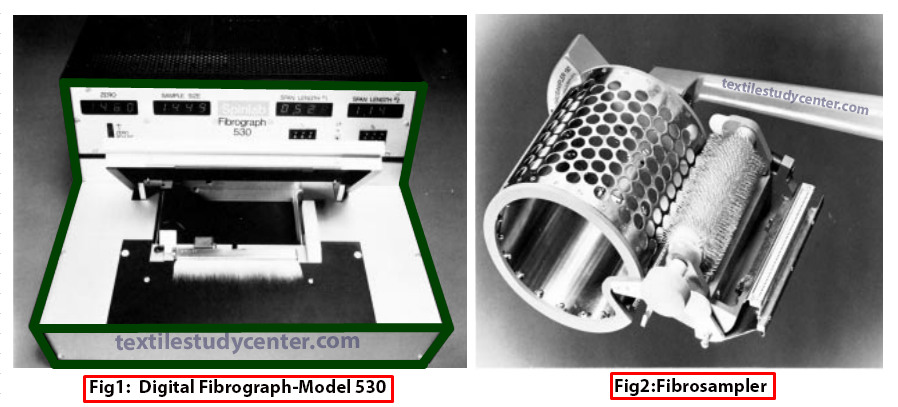
Fibro sampler is used in later models to clamp the fibers on the comb. Fiber sample is put inside the cylinder of sampler. Fiber comb, with 13 needles/inch, is rotated around the fibro sampler, with pressure applied on the cotton, during which it picks up fibers projecting from the holes of sampler. The instrument is consequently insensitive to the presence of very short fibres, and in practice the Fibrogram has its origin at a point representing a length of 0.15 inch (3.8 mm).
Digital Fibrogram may be analyzed graphically to yield various length parameters of interest to the producers and users of cotton. The tangent to the curve at its starting point A cuts OY at P and OX at M. Then OM is the mean length of the fibers in the original population longer than 0.15 inch (3.8 mm). If OP is bisected at Q and the tangent to the curve from Q cuts OX at R, then OR is the upper-half mean length, UHML, and the ratio of OM to OR is a valid index of uniformity.
(0)
Fibrograph Method


0 comments:
Post a Comment